Showing posts with label numbers stuff. Show all posts

Monday, 6 June 2011

Numbers Stuff: Using Rolling Batting Averages To Look At Form


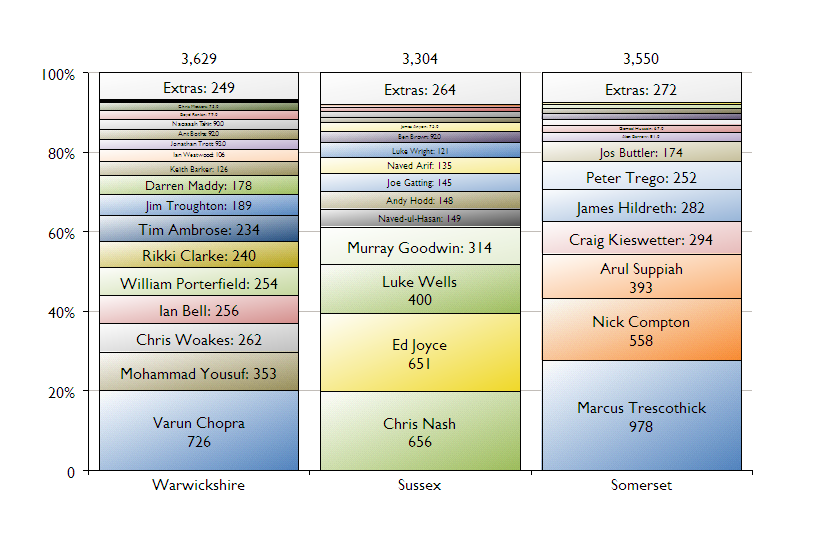
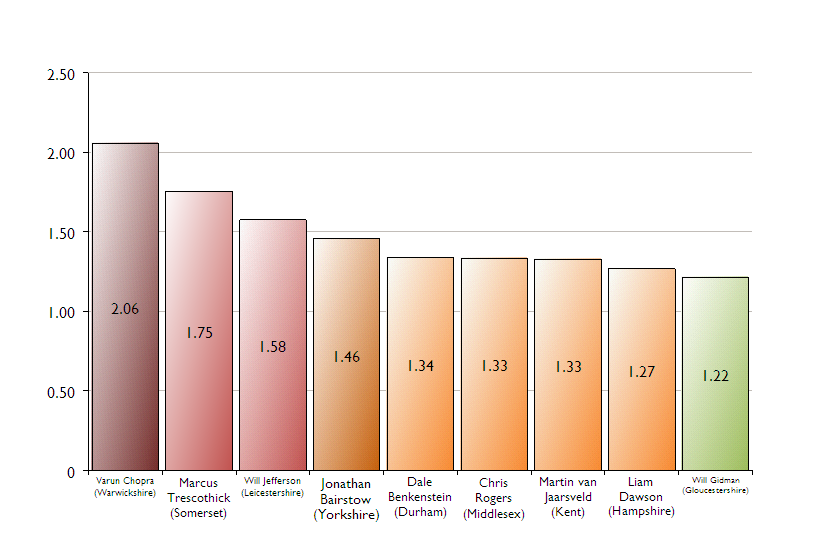
Here at 51allout we love all things cricket, despite the best efforts of Amjad's front foot and the weather at Lord's. But one thing we particularly love are the numbers. Cricket has always been a numbers game and Sky (et al) do a decent job of bringing these to life. But we can do a whole lot better than that...


Number Two: Using Rolling Batting Averages To Look At Form

The idea of using a player's batting average to determine how good they were at the crease is a pretty fundamental one. And in general, it makes a lot of sense, particularly when looking back at
an entire career. Across a large number of innings the balance of good and bad luck should have evened out, so a player usually ends up pretty much where they deserve to be in the greater scheme of things.

But while the destination is one thing, we're far more interested in the journey.

In order to compare a player's form against their overall career record, we can use the idea of a rolling batting average. Here we take the players last x number of innings and calculate their average, exactly as we would for their career overall. We can then track this rolling average throughout their career, to see the peaks and troughs.

For the sake of this analysis we've taken x to be ten, so that we consider the last ten visits to the crease for each player. Why ten? There are a few reasons but the main one is that this represents a 'reasonable' length of time. One or two bad innings alone won't necessarily drag it down while one big innings won't inflate it excessively. It would also represent a full five test series in theory, but that's wishful thinking these days.

As with all these things, it's easier to work through an example so we'll get straight into it. Here we're looking at the Test career of Michael Vaughan (career batting average 41.44, which is decent, but not great).

Image

In order to make it easier to follow, it's broken up into years by the green lines. Note that there's no 2006, due to Vaughan's knee problems.

The blue line is Vaughan's cumulative career average. So after ten innings (at the start of the chart) it was 27.8. After 147 innings it was 41.44 (the end of the chart). It actually peaked at around 51.57, somewhere around the start of 2003.

Now the red line is Vaughan's rolling ten innings average. This tells us lots about how he ended up with his final numbers. Towards the end of 2002 his rolling average is up around 100 - this is due to some serious scores against India (100, 197 and 195) and his first hundred vs. Australia (177).

After this peak, however, it's a series of ups and downs. The rolling average makes a few excursions above 50 and a few below 30 and is seriously tailing off from 2007 onwards. It's this patchy form from 2003 onwards that saw Vaughan drop from a top-drawer average (above 50) to a reasonable one (above 40), i.e. the short term form drags the career average down. It's no coincidence that this was the also the period when he captained the side.

Let's consider another example now: Paul Collingwood (career batting average 40.56)

Image

Even though Collingwood ended up with a very similar average to Vaughan there aren't the same peaks - his rolling average touches 70 a couple of times - and the low is much lower, with his rolling average just 11 at the end of his career. In between though, there isn't quite the same up and down variation that Michael Vaughan had i.e. Collingwood was more likely to scratch around for a few runs, rather than get out cheaply.


While it's quite tempting to fill the internet up by doing these charts for everyone who's ever batted ten times in Test Cricket, it's probably not the best use of a bank holiday. Instead, there's another step of analysis from this, that we'll save for a blog post in the not too distant future...

Saturday, 28 May 2011

Numbers Stuff: Using Relative Market Share to determine 'One Man Teaminess'

Here at 51allout we love all things cricket, despite the best efforts of the IPL and the weather in Cardiff. But one thing we particularly love are the numbers. Cricket has always been a numbers game and Sky (et al) do a decent job of bringing these to life. But we can do a whole lot better than that...


Number One: Using Relative Market Share to determine 'One Man Teaminess'

Let's start at the beginning here, with a standard market share calculation. This is (like it says) just a calculation of what share of the total market someone has. We'll use a business example to get across the basics and then look at how we apply that to cricket.

In the exciting world of home console sales, two of the key markets are Japan and the United States. Here's how they might look, in terms of units sold in the last year:


Now Nintendo has a 40% share of both markets. But in the USA they're a lot more comfortable than in Japan, where Sony are close behind.

To measure this competitive position we use something called Relative Market Share. It's a pretty simple calculation:

For the market leader we use market leader sales/second place sales.
For everyone else we use company sales/market leader sales.

So in the USA Nintendo's RMS is 4.0m/1.6m = 2.5, Sony's is 1.6m/4.0m = 0.4 and Microsoft's is 1.0m/4.0m = 0.25.

In Japan Nintendo's RMS is 2.0m/1.9m = 1.05 while Sony's is 1.9m/2.0m = 0.95.

So what does this mean? Well for numbers greater than one, the greater the number the more dominant the position. For numbers less than one, the greater the number the closer to the market leader.

This sort of thing is very useful for strategic executive types, who use it to determine the marketing strategies in each market. So in the case above they might decide to move marketing dollars away from the USA (while still doing enough to try and maintain the status quo) and move them to Japan to try and aggressively improve their position, to ensure that they retain/improve their position as market leader.


Anyway, what relevance does this have to cricket? That's the fun part. Let's start by having a look at some selected teams' run scoring from this season's County Championship.


Now there's a few things to draw from this but let's start with Warwickshire, where Varun Chopra has scored 20% of the team's total runs, and Sussex, where Chris Nash has also scored 20% of the total.

In Warwickshire's case there's then a big gap to Mohammad Yousuf's 353 runs. In Sussex's case there's just a tiny gap from Nash to Ed Joyce (all of five runs behind). So it's fair to say that Warwickshire are much more of a one man team (in batting terms). So how do we quantify this? We use Relative Market Share.

So for Varun Chopra we do 726/353 = 2.06
For Chris Nash we do 656/651 = 1.01

Here the bigger the number the more 'one man teamy' a side is. In Warwickshire's case this value is very high (anything above 1.5 should probably be considered high), emphasising how dependent they are on one player. For Sussex it couldn't be much lower, emphasising how they're not dependent on one player but in fact on a number of players.

In Somerset's case Marcus Trescothick has scored a massive 28% of the total runs. But it only works out as an RMS value of 1.75 (i.e. still quite a bit below Warwickshire) because of the good form of Nick Compton.


So let's calculate this RMS for the top scorers for each county side and see what it says.


There we are then - we have a scale of 'one man teaminess', with Warwickshire, Somerset and Leicestershire at one end and Surrey, Sussex and Glamorgan at the other.

There are some other things we could look at around this - for instance, the number of players to get to a specific percentage of a team's runs - but we'll save those for another day.