
Number One: Using Relative Market Share to determine 'One Man Teaminess'
Let's start at the beginning here, with a standard market share calculation. This is (like it says) just a calculation of what share of the total market someone has. We'll use a business example to get across the basics and then look at how we apply that to cricket.
In the exciting world of home console sales, two of the key markets are Japan and the United States. Here's how they might look, in terms of units sold in the last year:

Now Nintendo has a 40% share of both markets. But in the USA they're a lot more comfortable than in Japan, where Sony are close behind.
To measure this competitive position we use something called Relative Market Share. It's a pretty simple calculation:
For the market leader we use market leader sales/second place sales.
For everyone else we use company sales/market leader sales.
So in the USA Nintendo's RMS is 4.0m/1.6m = 2.5, Sony's is 1.6m/4.0m = 0.4 and Microsoft's is 1.0m/4.0m = 0.25.
In Japan Nintendo's RMS is 2.0m/1.9m = 1.05 while Sony's is 1.9m/2.0m = 0.95.
So what does this mean? Well for numbers greater than one, the greater the number the more dominant the position. For numbers less than one, the greater the number the closer to the market leader.
This sort of thing is very useful for strategic executive types, who use it to determine the marketing strategies in each market. So in the case above they might decide to move marketing dollars away from the USA (while still doing enough to try and maintain the status quo) and move them to Japan to try and aggressively improve their position, to ensure that they retain/improve their position as market leader.
Anyway, what relevance does this have to cricket? That's the fun part. Let's start by having a look at some selected teams' run scoring from this season's County Championship.
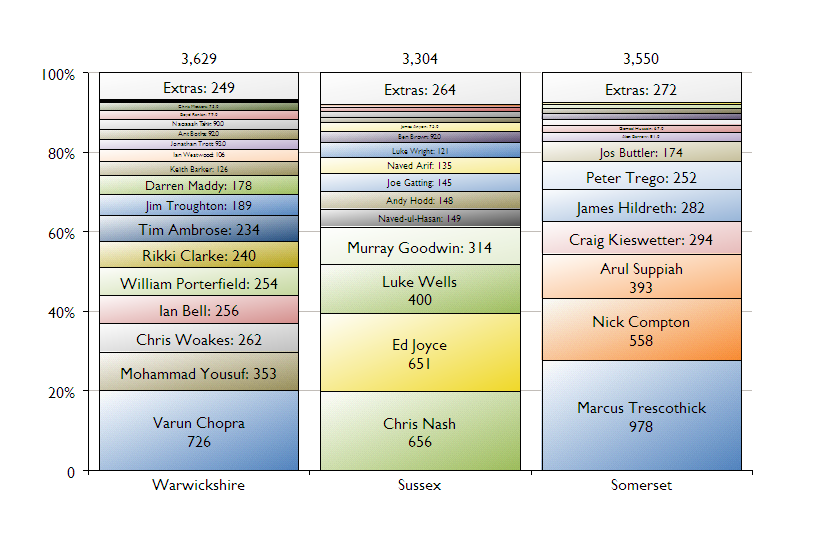
Now there's a few things to draw from this but let's start with Warwickshire, where Varun Chopra has scored 20% of the team's total runs, and Sussex, where Chris Nash has also scored 20% of the total.
In Warwickshire's case there's then a big gap to Mohammad Yousuf's 353 runs. In Sussex's case there's just a tiny gap from Nash to Ed Joyce (all of five runs behind). So it's fair to say that Warwickshire are much more of a one man team (in batting terms). So how do we quantify this? We use Relative Market Share.
So for Varun Chopra we do 726/353 = 2.06
For Chris Nash we do 656/651 = 1.01
Here the bigger the number the more 'one man teamy' a side is. In Warwickshire's case this value is very high (anything above 1.5 should probably be considered high), emphasising how dependent they are on one player. For Sussex it couldn't be much lower, emphasising how they're not dependent on one player but in fact on a number of players.
In Somerset's case Marcus Trescothick has scored a massive 28% of the total runs. But it only works out as an RMS value of 1.75 (i.e. still quite a bit below Warwickshire) because of the good form of Nick Compton.
So let's calculate this RMS for the top scorers for each county side and see what it says.
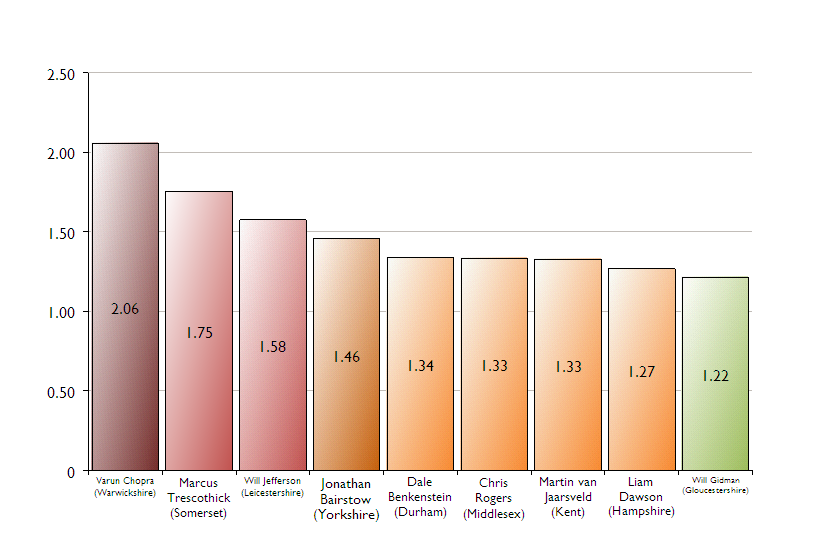

There we are then - we have a scale of 'one man teaminess', with Warwickshire, Somerset and Leicestershire at one end and Surrey, Sussex and Glamorgan at the other.
There are some other things we could look at around this - for instance, the number of players to get to a specific percentage of a team's runs - but we'll save those for another day.
No comments:
Post a Comment